 |
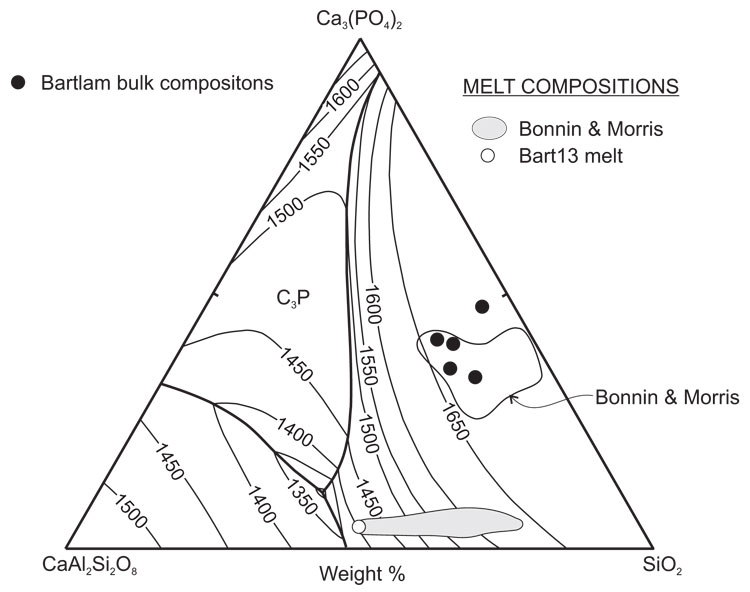
| Figure 8 Tricalcium phosphate-anorthite-silica phase diagram (after St. Pierre, “Constitution of Bone China,” p. 149) comparing the compositions of Bartlam and Bonnin and Morris porcelain and the melt phases therein. Note that the bulk composition of one Bartlam sample (altered sherd Bart10) plots outside the Bonnin and Morris field. |
|
|