


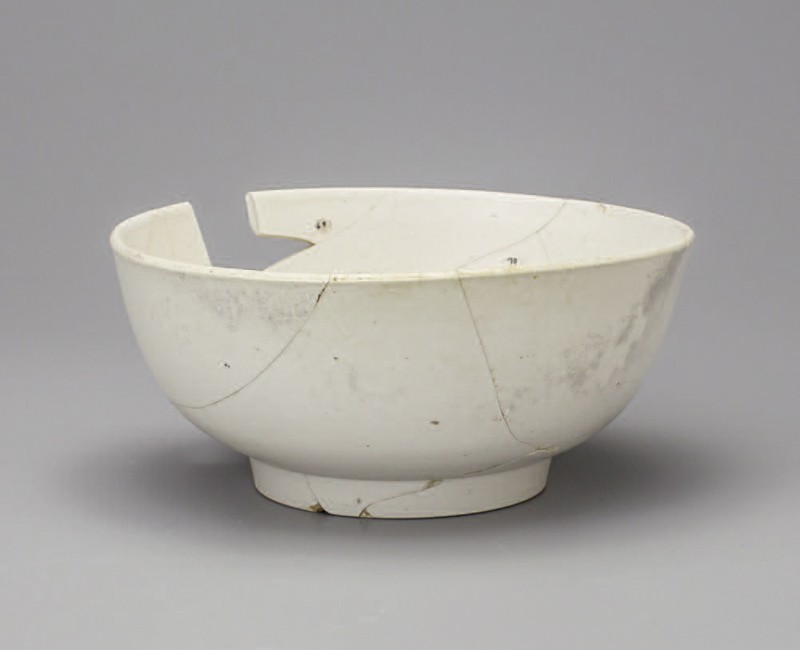
Punch bowl, attributed to American China Manufactory, Philadelphia, Pennsylvania, ca. 1772. Hard-paste porcelain. D. 5 1/2". (Courtesy, The Museum of the American Revolution; photo, Robert Hunter.) Excavated from a privy" on the site of the proposed Museum of the American Revolution in Philadelphia.
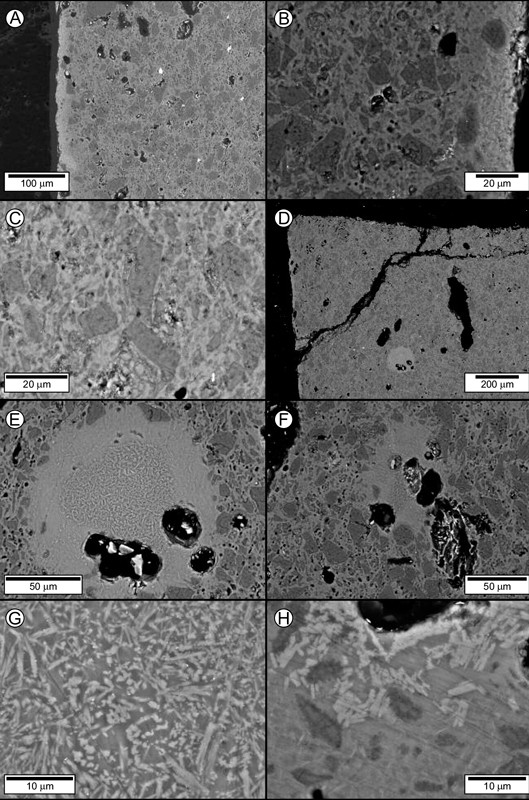
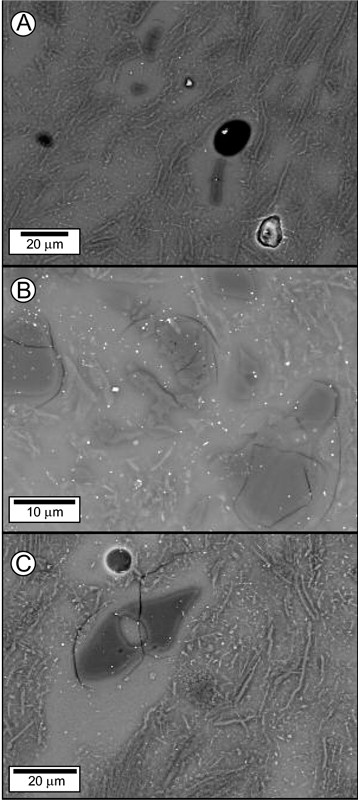
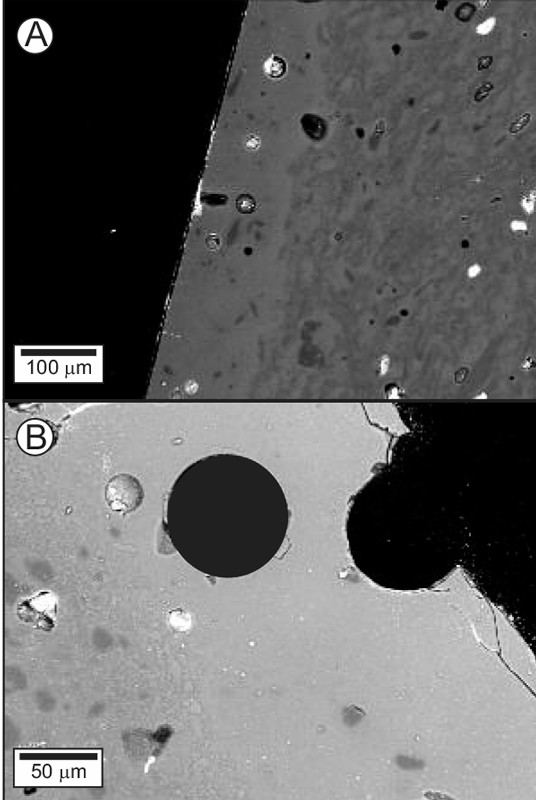
Backscattered-electron images of the Philadelphia bowl. (A) Thin glaze (left side of image) with an S-A-C composition coating the aluminous-silicic paste. Black patches in this and other images are holes (pores). (B) Close-up showing the glaze (right side of image, above scale) and its ceramic substrate. Note the calcic plagioclase microlites in the glaze, the integrated body-glaze layer, and the subangular silica polymorphs (dark gray grains, probably α-quartz) in the substrate. (C) Subangular silica polymorphs (probably α-quartz) in a mullite-laden melt phase. (D) Overview of the corner of a mounted sherd from the bowl, showing a circular melt patch (lower middle part of image). (E) Close-up of the circular melt patch showing the concentration of relatively coarse grained mullite crystallites in the center. (F) Irregular-shaped melt patch. Note the coarse mullite crystallites in the center. (G) Relatively coarse-grained mullite microlites in the core of the circular melt patch. (H) Calcic plagioclase microlites in the irregular-shaped melt patch. Finer-grained mullite microlites (indistinct, felty, medium-gray crystals) occur in the melt in the lower left part of the image.
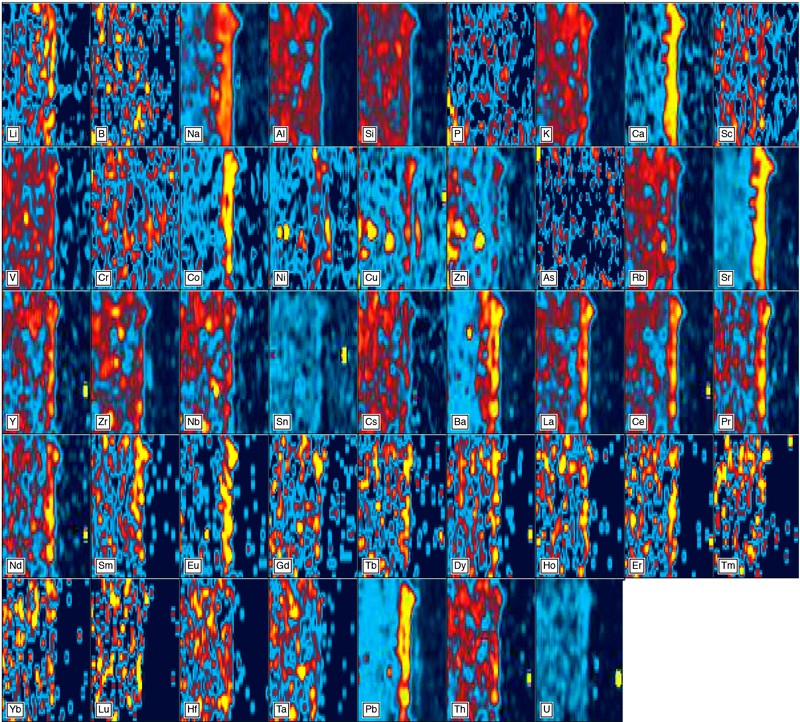
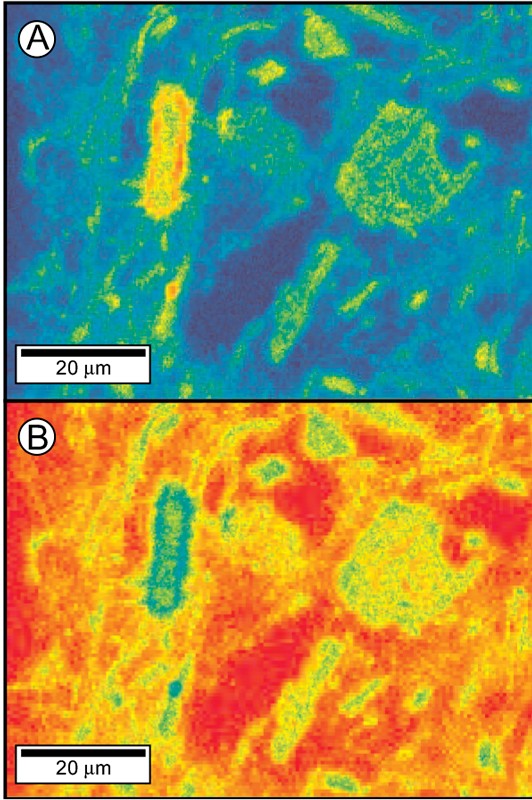
Compositional maps of part of the glaze and ceramic substrate of the Philadelphia bowl. “Hot” colors (yellows and reds) denote high concentrations of each component; “cool” colors (greens and blues) denote low concentrations. These images were generated by ICP-LA-MS using an 8-micron beam and 20 lines across the imaged areas.
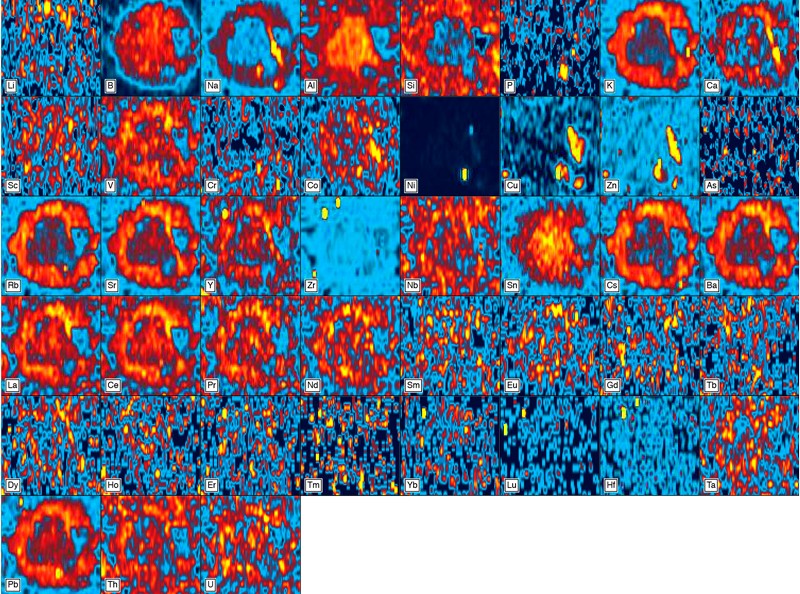
Compositional maps of a spherical melt bleb (see figs. 2D, E) in the body of the Philadelphia bowl. These images were generated by ICP-LA-MS using an 8-micron beam and 20 lines across the imaged area.
Backscattered-electron images of the aluminous-silicic paste of (A) a sherd (Bart11) from the Cain Hoy site of John Bartlam’s potworks, and (B, C) a William Cookworthy figure (sample Ck1). Note the abundance in both samples of the matrix melt phase, the well-rounded character of relict quartz grains entrained in the melt, and the high aspect ratio of mullite. The melt patch enclosing the resorbed quartz grain in (C) contains 79 percent SiO2.
Compositional map for a small area of the body of a Cookworthy figure (sample Ck1). (A) Alumina; (B) silica. In (A), mullite appears as elongated, yellow and red domains, whereas quartz occupies blue patches, and the melt phase the milky-green areas, and in (B), quartz is red, mullite green, and the melt orange. The minute red speckles in (A) are possibly corundum (Al2O3), a high-temperature breakdown product of mullite.
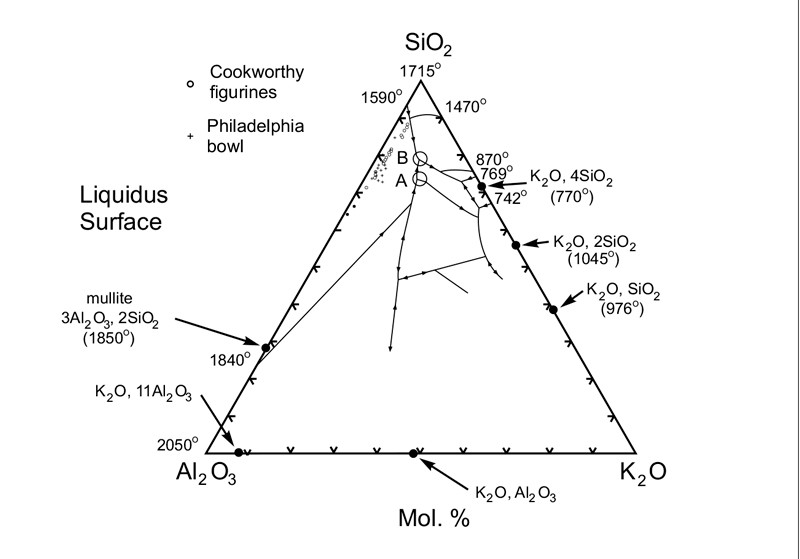
Silica-alumina-potash diagram showing the displacement of melt compositions by mullite microlites. Modified after E. F. and A. Muan, Phase Equilibrium Diagrams of Oxide Systems: 5, K2O-Al2O3-SiO2 (Columbus, Ohio: American Ceramic Society, 1960).
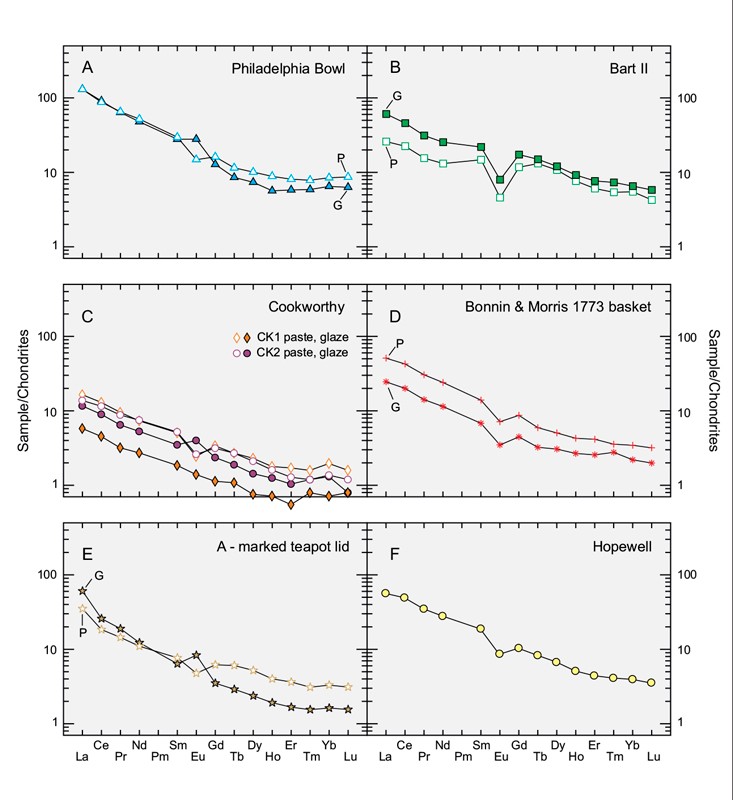
Chondrite-normalized REE plots for the pastes (P) and glazes (G) of (A) the Philadelphia bowl, (B) sample Bart11, (C) two Cookworthy figures, (D) the 1773 Bonnin & Morris openwork basket, (E) the A-marked porcelain teapot lid, and (F) the average of five unvitrified aluminous-silicic biscuit wasters from Hopewell, Virginia.
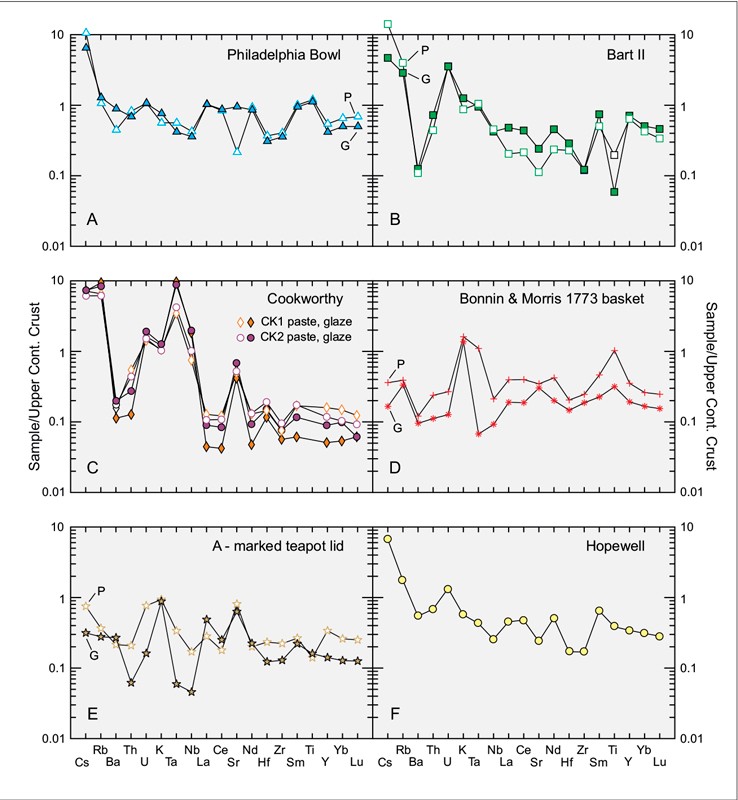
Mean-continental crust-normalized spider diagrams for the pastes (P) and glazes (G) of (A) the Philadelphia bowl, (B) sample Bart11, (C) two Cookworthy figures, (D) the 1773 Bonnin & Morris openwork basket, (E) the A-marked porcelain teapot lid, and (F) the average of four unglazed and unvitrified aluminous-silicic sherds from Hopewell, Virginia.
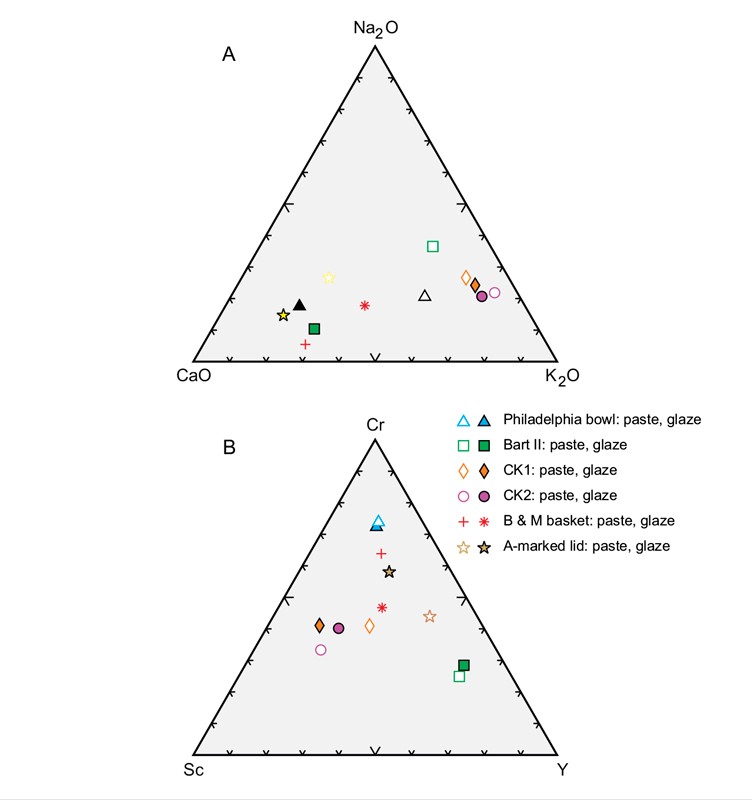
Comparison of the pastes and glazes of the samples described here plotted on (A) Na2O-CaO-K2O and (B) Cr-Sc-Y diagrams.
Backscattered-electron images of the glazes on (A) Cookworthy sample Ck1 and (B) Bartlam sample Bart11. Note the comparative thickness of these glazes (vis-à-vis the glaze on the Philadelphia bowl, see figs. 2A, B), and the absence of microlites.