


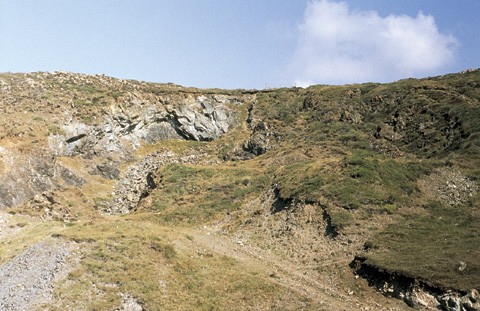
Gew Grange soapstone quarry. (Photo, Victor Owen.)
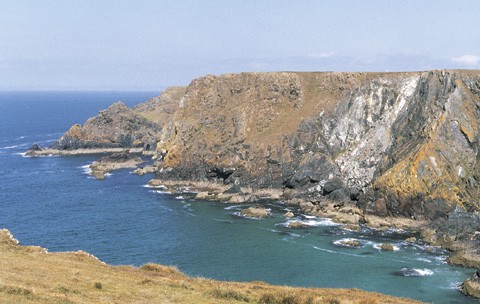
A view of the bay at the end of the Gew Grange quarry. The pale band in the cliff is a shear zone in which soapstone formed at the expanse of the dark host rock (peridotite). (Photo, Victor Owen.)
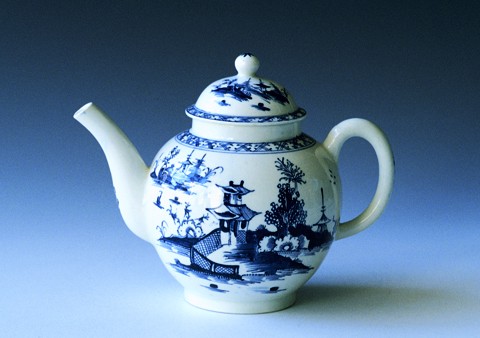
Teapot, Lowestoft, ca. 1770. Soft-paste porcelain. H. 6". (Courtesy, Roderick Jellicoe.)
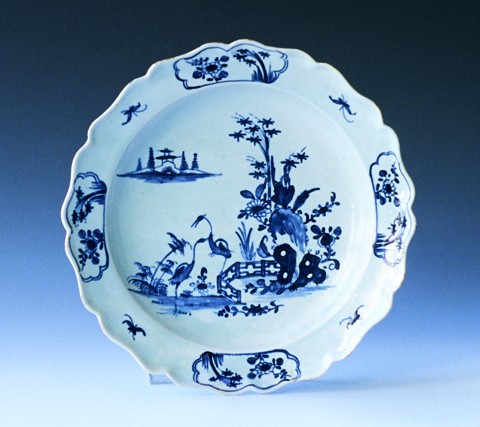
Plate, William Reid, Liverpool, ca. 1757. Soft-paste porcelain. D. 9". (Courtesy, Roderick Jellicoe.)
Coffee can, William Reid, Liverpool, ca. 1758. Soft-paste porcelain. H. 2 1/4". (Courtesy, Roderick Jellicoe.
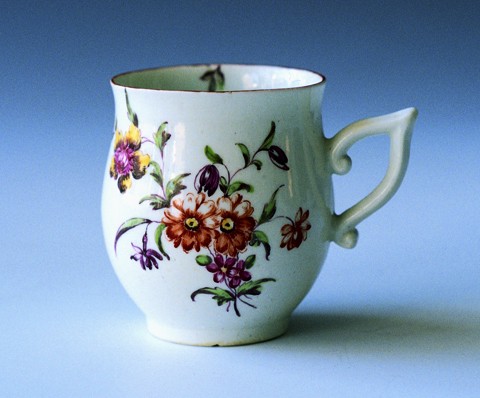
Coffee cup, Derby, ca. 1758. Soft-paste porcelain. H. 6". (Courtesy, Roderick Jellicoe.) This enameled example has an unusual ear-shaped handle.
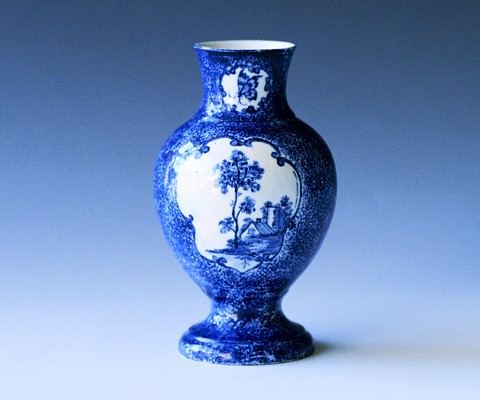
Vase, Derby, ca. 1760. Soft-paste porcelain. H. 6". (Courtesy, Roderick Jellicoe.)
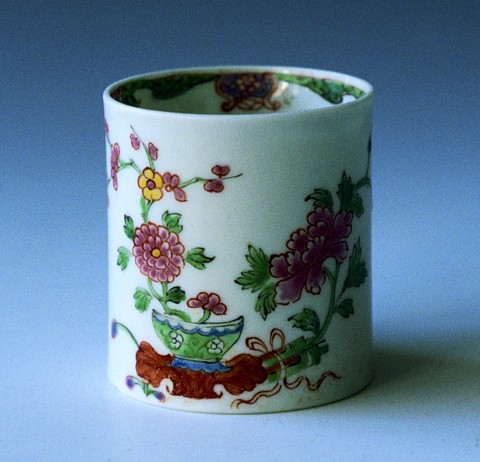
Coffee can, Samuel Gilbody, Liverpool, ca. 1758. Soft-paste porcelain. H. 2 1/2". (Courtesy, Roderick Jellicoe.)
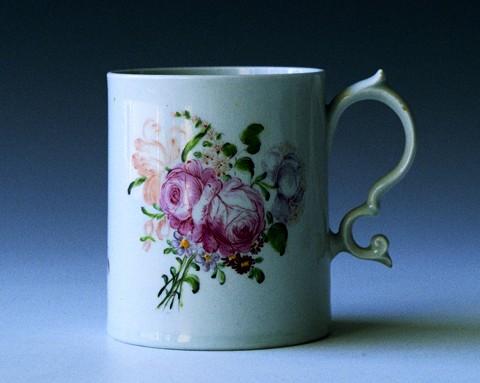
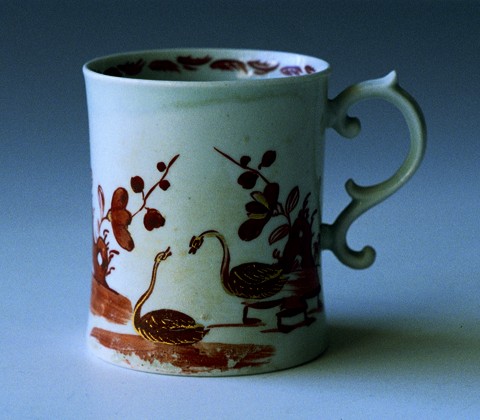
Mug, Samuel Gilbody, Liverpool, ca. 1758. Soft-paste porcelain. H. 3 1/2". (Courtesy, Roderick Jellicoe.)
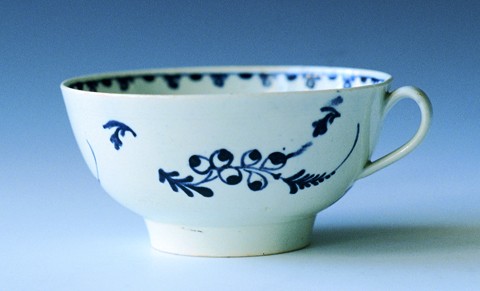
Breakfast cup, Pennington’s, Liverpool, ca. 1785. Soft-paste porcelain. D. 4 1/2". (Courtesy, Roderick Jellicoe.)
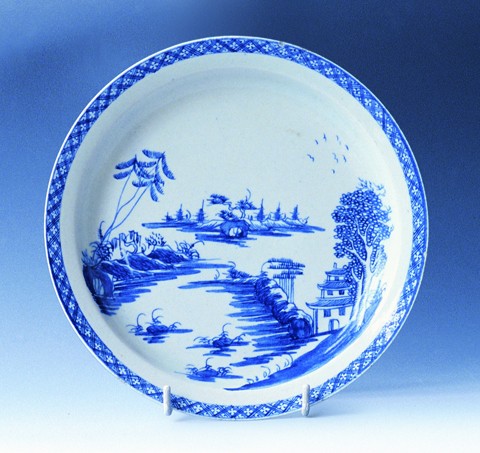
Plate, Bow, ca. 1756. Soft-paste porcelain. D. 8". (Courtesy, Roderick Jellicoe.)
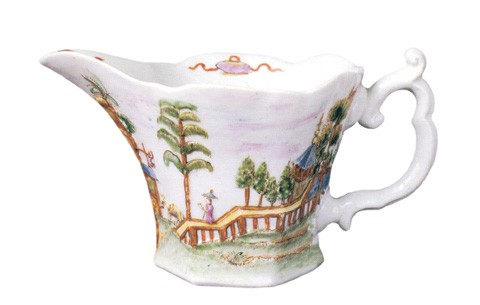
Sauceboat, Worcester, ca. 1754, Soft-paste porcelain. H. 2 3/4". (Courtesy, Victor Owen.)
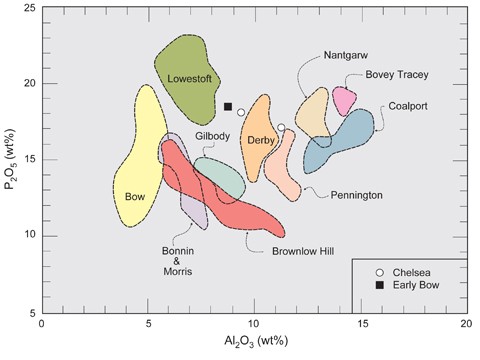
Identification of eighteenth-century porcelain factories based on bulk alumina contents (Al2O3).
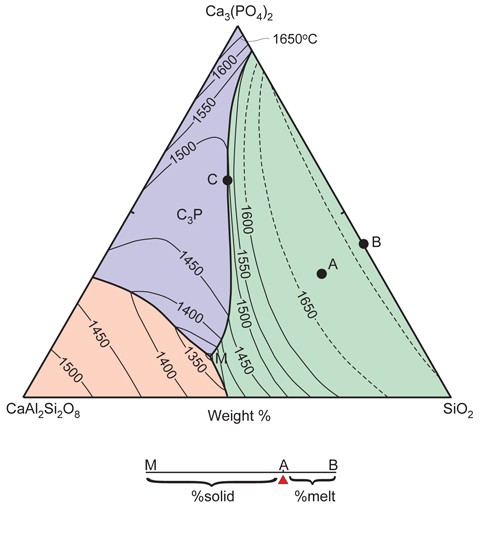
Phase diagram of how porcelain pastes melt in kiln temperatures.
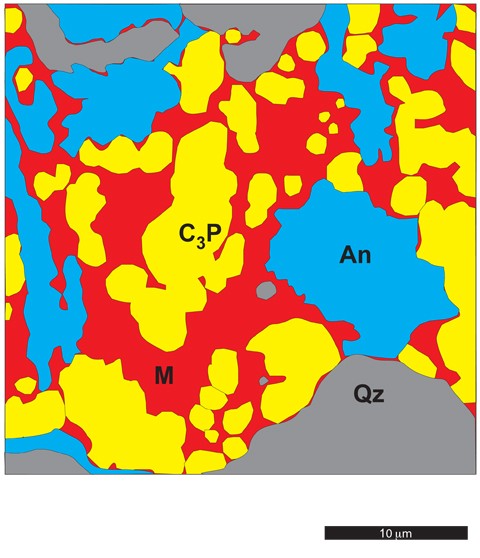
Diagram showing the shape (morpohology) during heating.
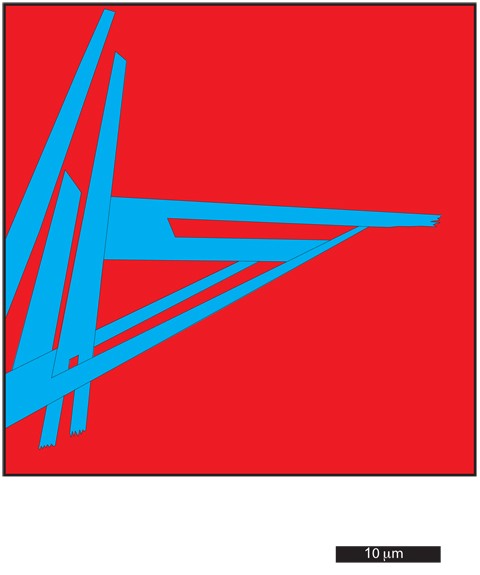
Diagram showing crystallized mineral grain.